
A genogram is more than a family tree—it is a visual language that communicates family structure, relationships, and health patterns across generations. To read and create effective genograms, practitioners must understand the standardized symbols that form this language.
Looking for a quick reference? See our Genogram Symbols Reference Chart for a table-based overview of all symbols, or continue reading for in-depth explanations with clinical context.
📄 Download the free PDF Cheat Sheet — print-friendly, one page.
Genogram Symbol Quick Reference Table
| Symbol Type | Visual | Meaning | Usage |
|---|---|---|---|
| Male | Represents male family members | Basic structural symbol | |
| Female | Represents female family members | Basic structural symbol | |
| Unknown Gender | Gender not known or unspecified | For pregnancy losses, unborn children | |
| Deceased Male | Deceased male family member | X drawn through gender symbol | |
| Deceased Female | Deceased female family member | X drawn through gender symbol | |
| Marriage | Married couple | Horizontal solid line between partners | |
| Divorce | Divorced couple | Two slashes through marriage line | |
| Close/Harmonious | Very close, harmonious relationship | Two parallel lines between people | |
| Conflict | Conflictual relationship | Zigzag/jagged line between people | |
| Cutoff | Estranged, no contact | Break/fence in the connection line | |
| Biological Child | Biological parent-child connection | Solid line from parents to child | |
| Adopted Child | Adopted parent-child relationship | Dashed line from parents to child | |
| Foster Child | Foster care relationship | Dotted line from parents to child | |
| Twins | Twin siblings | Lines converge to single point on family line | |
| Miscarriage | Pregnancy loss / spontaneous abortion | Small triangle with X | |
| Stillbirth | Baby died at birth | Gender symbol with X and "SB" label | |
| Pregnancy | Current pregnancy in progress | Triangle symbol on family line | |
| Health Condition | Medical or mental health condition | Quadrant fill or pattern inside symbol |
This table shows the most commonly used genogram symbols. For complete details and visual examples, continue reading the guide below. Create your own genogram using WebGeno with all these symbols built-in.
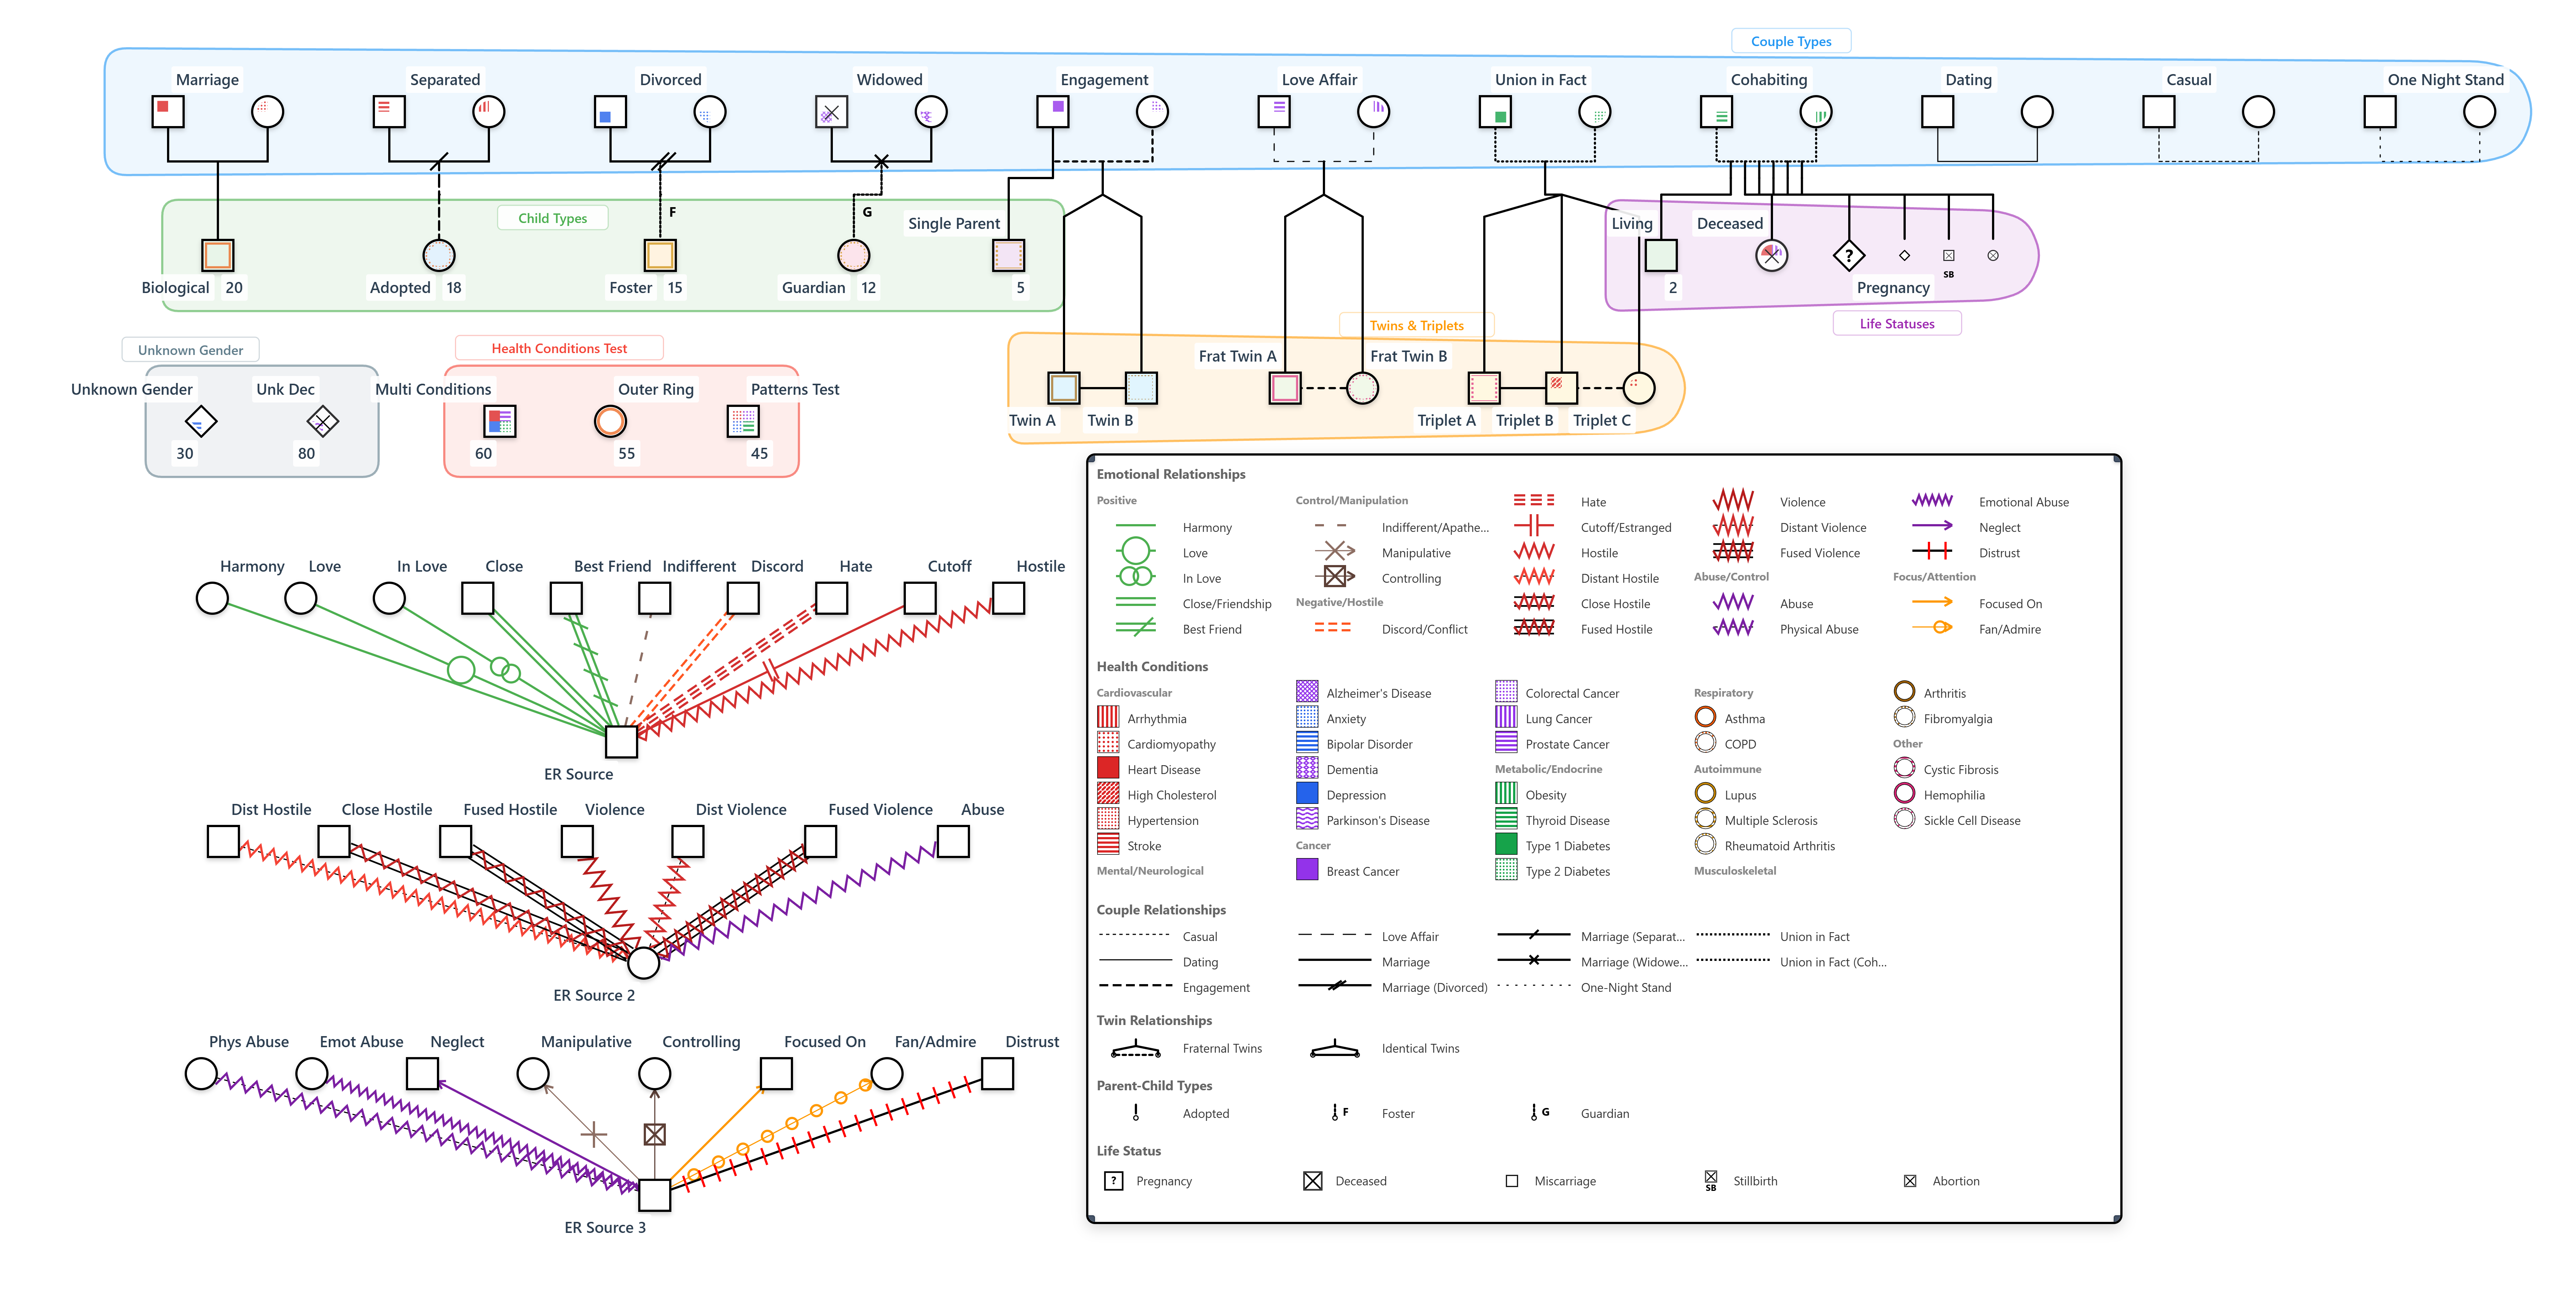
Murray Bowen established the foundational symbols for family diagrams in 1966, creating what Piasecka et al. (2018) describe as a standardized visual system for representing family information. Since then, the symbol set has expanded significantly. According to their systematic review, contemporary genogram practice uses approximately 100 distinct symbols organized into three main categories: structural symbols depicting family members, line symbols representing relationships, and graphic symbols indicating health conditions and life circumstances.
Structural Symbols: Representing Family Members
The most fundamental genogram symbols represent individual family members. These symbols convey basic demographic information at a glance.
Gender Symbols
The core gender symbols have remained consistent since Bowen's original system:
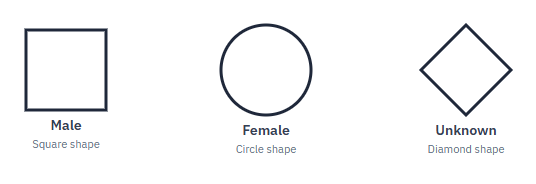
- Square: Male
- Circle: Female
- Diamond or Question Mark: Gender unknown or unspecified
Age and Status Indicators
Additional information can be incorporated into or around these basic shapes:
- Age: Written inside the symbol or below it
- Name: Written below or beside the symbol
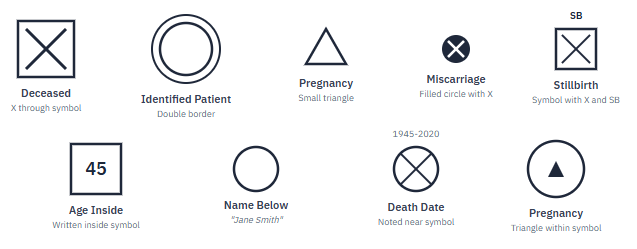
- Deceased: An "X" through the symbol, with death date noted
- Identified patient/client: Double border around the symbol
- Pregnancy: Small triangle or circle within the mother's symbol
- Miscarriage: Small filled circle or triangle with an "X"
- Stillbirth: Symbol with an "X" and "SB" notation
Birth Order and Placement
According to standard conventions, children are arranged from left to right in order of birth, with the oldest on the left (Piasecka et al., 2018). Butler (2008) notes that in Bowen's original family diagram format, males were placed on the left and females on the right of couple pairings.
Relationship Lines: Mapping Family Connections
Relationship lines connect individual symbols to show how family members relate to one another. These lines represent both legal/biological relationships and emotional patterns.
Couple Relationships
Horizontal lines connect partners and indicate their relationship status:
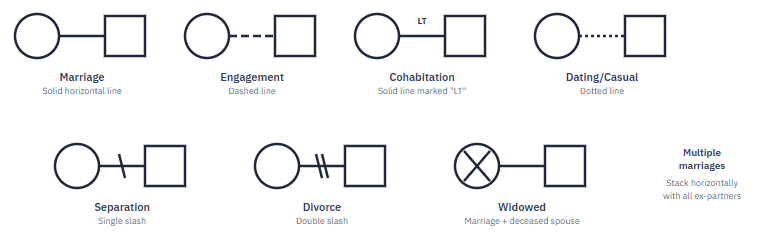
- Marriage: Single solid horizontal line
- Cohabitation/Living together: Single solid line, sometimes marked "LT" (Butler, 2008)
- Engagement: Single solid line with notation
- Separation: Single line with one diagonal slash
- Divorce: Single line with two diagonal slashes
- Multiple marriages: Shown sequentially, with most recent typically on the outer edge
Parent-Child Connections
Vertical lines connect parents to children:
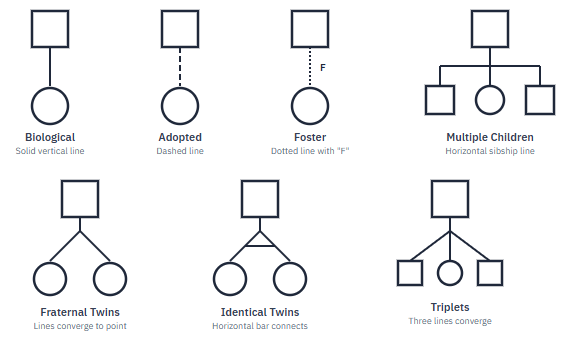
- Biological child: Solid vertical line from the couple line to the child
- Adopted child: Dotted or dashed vertical line, or solid line with brackets
- Foster child: Dotted line with "F" notation
- Twins: Two vertical lines converging to a single point on the couple line
- Identical twins: Twins connected by a horizontal bar
Emotional Relationship Patterns
Beyond structural connections, genograms can depict the quality and nature of relationships between family members. McGoldrick and colleagues developed an extensive system of relationship lines that Butler (2008, p. 175) describes as the "gold standard" for genogram practice.
Common Relationship Patterns
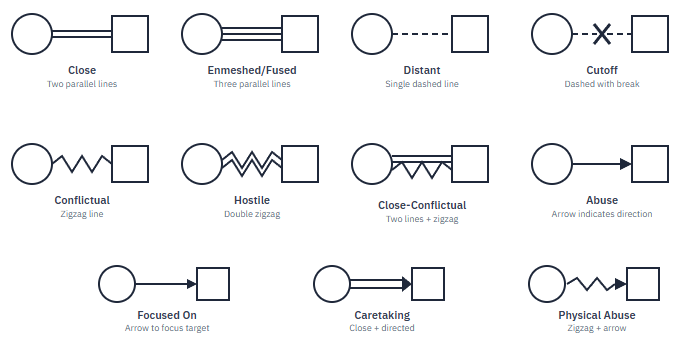
- Close/Harmonious: Two parallel lines
- Very close/Enmeshed: Three parallel lines
- Distant: Single dotted line
- Estranged/Cut off: Line with break or perpendicular marks
- Conflictual: Zigzag or wavy line
- Close and conflictual: Combination of parallel and zigzag lines
- Focused on: Arrow pointing toward the focus of attention
- Abusive: Zigzag with specific notation
These relationship indicators help practitioners visualize emotional patterns that may span multiple generations, supporting assessment of what Bowen termed the "multigenerational transmission process" (Puskar & Nerone, 1996).
See these symbols in action.
WebGeno includes all standard relationship symbols — just click to add. Free, no sign up.
Try WebGeno Free →Health and Social Condition Symbols
One of the most clinically useful aspects of genograms is their capacity to track health conditions, mental health issues, and social circumstances across generations. Piasecka et al. (2018) identified 61 graphic symbols for diseases, disabilities, and disorders in their systematic review.
Standard Approaches from the Literature
The traditional method for representing health conditions involves filling or marking the individual's symbol:
- Filled/shaded symbol: Indicates presence of a condition
- Half-filled symbol: Carrier status or partial condition
- Sectioned symbols: Some practitioners divide symbols into sections to represent multiple conditions or categories
However, as Piasecka et al. (2018) note, there is "incomplete symbol standardization" for health conditions across the literature. Different practitioners and software tools implement varying approaches to this challenge.
WebGeno's Pattern-Based Implementation
WebGeno addresses the standardization challenge by implementing a pattern-based system that builds on the quadrant concept from the literature while adding visual differentiation:
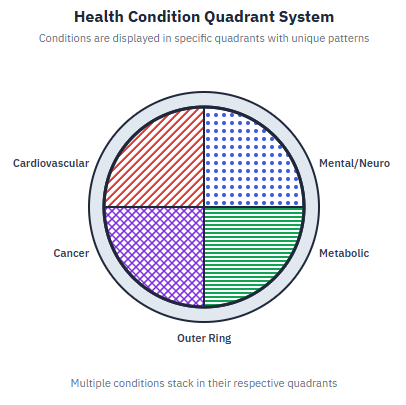
- Four inner quadrants: Cardiovascular (top-left), Mental/Neurological (top-right), Cancer (bottom-left), Metabolic/Endocrine (bottom-right)
- Outer ring: Additional categories including Respiratory, Autoimmune, Musculoskeletal, and Other conditions
- Distinct patterns: Each category uses a unique visual pattern (diagonal stripes, dots, crosshatch, horizontal lines, etc.) to aid quick identification
This WebGeno-specific implementation supports 47 pre-defined health conditions across 8 categories, with the ability to add custom conditions as needed.
Common Condition Categories
Regardless of the specific notation system used, practitioners commonly track:
- Cardiovascular conditions: Heart disease, hypertension, stroke
- Mental health: Depression, anxiety, bipolar disorder, schizophrenia
- Substance use: Alcohol abuse, drug addiction
- Cancer: Breast, colon, lung, and other malignancies
- Metabolic disorders: Diabetes, thyroid conditions
- Neurological conditions: Dementia, Parkinson's disease
47 health conditions, built right in.
WebGeno's pattern-based system makes tracking conditions across generations effortless.
Start Building →Specialized Symbol Systems
As genogram practice has evolved, practitioners have developed specialized symbol sets for specific clinical contexts.
Variations by Theoretical Approach
Butler (2008) documents numerous specialized genogram types, each with adapted symbols:
- Cultural Genogram (Hardy & Laszloffy, 1995): Incorporates cultural identity markers
- Spiritual Genogram (Wiggins-Frame, 2000): Religious affiliation and spiritual practices
- Sexual Genogram (Hof & Berman, 1986): Attitudes and patterns related to sexuality
- Time-line Genogram (Friedman et al., 1988): Temporal sequencing of events
Best Practices for Using Symbols
Consistency and Clarity
Whatever symbol system you use, consistency is essential. Piasecka et al. (2018) note that incomplete symbol standardization remains a challenge. To maintain clarity:
- Use a legend to define any symbols that might be ambiguous
- Follow established conventions (McGoldrick et al. remains the primary reference)
- Apply the same symbols consistently throughout a single genogram
Practical Considerations
- Keep it readable: Avoid overcrowding with too many symbols
- Use color strategically: Color can differentiate condition categories but ensure accessibility
- Date your genogram: Family situations change; dating helps track evolution
- Include a key: Especially important when sharing genograms across disciplines
Conclusion
Genogram symbols provide practitioners with a powerful visual vocabulary for documenting family patterns across generations. From basic structural symbols established by Bowen in the 1960s to contemporary additions for health conditions and relationship patterns, this system enables efficient communication of information that would otherwise require extensive narrative description.
Mastering these symbols allows practitioners to create genograms that serve multiple purposes: clinical assessment, treatment planning, client education, and professional communication. For practitioners new to genograms, beginning with the fundamental structural and relationship symbols provides a solid foundation. As familiarity grows, incorporating health condition tracking and specialized symbol systems can enhance the clinical utility of this essential assessment tool.
Ready to put these symbols into practice? Learn how to create a complete genogram from start to finish in our comprehensive step-by-step genogram tutorial, which walks you through the entire process of family assessment using these powerful visual tools.

Frequently Asked Questions About Genogram Symbols
What does a diamond mean in a genogram?
A diamond symbol represents unknown gender in a genogram. This is commonly used for:
- Pregnancy losses where gender wasn't determined
- Unborn children during current pregnancies
- Miscarriages in early pregnancy stages
- Situations where family members don't know or remember the gender
The diamond provides a neutral way to include these individuals in the family structure without making assumptions about gender.
What is the triangle symbol in a genogram?
Triangle symbols in genograms typically represent pregnancy outcomes or current pregnancies:
- Small triangle: Often used for miscarriage (pregnancy loss)
- Triangle with '?': Current ongoing pregnancy
- Triangle with 'X': Pregnancy loss or termination
Some practitioners use triangles as an alternative to diamonds for unknown gender, but pregnancy-related meanings are more common.
What are genogram relationship symbols?
Genogram relationship symbols show the quality and type of connections between family members:
- Single line (—): Marriage or formal relationship
- Double line (═): Close, harmonious relationship
- Triple line (≡): Enmeshed, overly close relationship
- Dotted line (⋯): Distant relationship
- Zigzag line (~~~): Conflictual relationship
- Broken line (— | —): Cutoff or estranged relationship
- Line with slashes (//): Divorce or separation
These symbols help visualize family dynamics and emotional patterns across generations.
How do you show adoption in a genogram?
Adoption is shown using dotted or dashed lines in genograms:
- Dotted vertical line: From adoptive parents down to the child
- Brackets: Some practitioners use brackets around the child's symbol
- "A" notation: Adding an "A" label near the connection line
- Different line style: Dashed instead of solid lines
The key is to distinguish adopted relationships from biological ones while maintaining clear family structure. Most practitioners use dotted lines as the standard approach.
How do you show twins in a genogram?
Twin relationships are shown with special connection patterns:
- Fraternal twins: Two separate vertical lines coming from the same point on the parents' marriage line
- Identical twins: Same as fraternal, but with a horizontal bar connecting the two children's symbols
- Birth order: Twins are typically placed side by side with the firstborn on the left
This notation makes it clear that the children were born at the same time while indicating whether they are identical or fraternal.
What do the different line types mean in genograms?
Line types in genograms communicate relationship quality and legal status:
- Thickness: Thicker lines often indicate closer or more significant relationships
- Solid lines: Strong, clear relationships (marriage, biological children)
- Dashed/dotted: Weaker, uncertain, or non-biological relationships
- Pattern variations: Different textures show different types of emotional connections
WebGeno automatically applies the correct line styles based on the relationship type you select.
How do you indicate health conditions in genograms?
Health conditions are typically shown by filling or marking the person's symbol:
- Solid fill: Person has the condition
- Half-fill: Carrier or partial condition
- Sectioned symbols: Different areas for different types of conditions
- Pattern fills: Different patterns for different condition categories
WebGeno uses a quadrant-based system with unique patterns for 47 different health conditions, making it easy to track medical history across generations.
Ready to create your own genogram with these symbols? Start free with WebGeno - all symbols are built-in and easy to use.
References
Butler, J. F. (2008). The family diagram and genogram: Comparisons and contrasts. The American Journal of Family Therapy, 36(3), 169–180. https://doi.org/10.1080/01926180701291055
McGoldrick, M., Gerson, R., & Petry, S. (2008). Genograms: Assessment and intervention (3rd ed.). W. W. Norton.
Piasecka, K., Slusarska, B., & Drop, B. (2018). Genograms in nursing education and practice: A sensitive but very effective technique: A systematic review. Journal of Community Medicine & Health Education, 8(6), 640. https://doi.org/10.4172/2161-0711.1000640
Puskar, K., & Nerone, M. (1996). Genogram: A useful tool for nurse practitioners. Journal of Psychiatric and Mental Health Nursing, 3, 55–60.
Create Professional Genograms with WebGeno
WebGeno includes all standard genogram symbols with an intuitive interface. Build clear, professional family diagrams in minutes.
Try WebGeno Free